Washington, D.C. consists of 68 square miles bound by Maryland, Virginia and the Potomac River. The District of Columbia is a federal enclave built on land ceded to the federal government by Maryland and Virginia to create a capital city that was not part of any state. The city is divided into four quadrants, or sections: Northwest, Southwest, Northeast and Southeast. The District experienced significant population growth between 2008 and 2011; the population currently exceeds 672,000. Most of this growth is attributed to migration into the City, with more than half attributed to international migration.

District of Columbia

According to the U.S. Census Bureau, in 2015, 47% of its residents identified as black, 36% identified as white, 11% as Hispanic, and 4% as Asian. The District has a white population that is three-fifths the national average, and a black population that is more than double the national average. The median household income is $73,115, which is higher than the national median income of $52,000. However, 18% of residents live in poverty, higher than the nationwide rate of 16%, and 92% of school age children are eligible for free and reduced-price meals (FARMS).
Demographics of DC Compared to National Averages
District residents tend to be less healthy than the average American. Life expectancy is 76.3 years; slightly lower than the national life expectancy of 78.9 years. The infant mortality rate is 8.6 per 1,000 live births, higher than the national rate of 5.9 per 1,000 live births. Heart disease is the leading cause of death among District of Columbia’s residents. Other health indicators for the city include the percent of adults diagnosed with diabetes at 7%, compared to 10.3% in the nation. UNAIDS has labeled HIV a generalized epidemic in DC, with a prevalence rate of 2695.8 cases per 100,000 people—compared to a national rate of 353.2 cases per 100,000 people. According to the Kaiser Family Foundation, several factors contribute to the high burden of HIV/AIDS in DC, including geography, access to health services, poverty, drug use, high rates of other sexually transmitted infections, stigma, and lack of knowledge about HIV status. While conditions do appear to be improving—a report from the DC Department of Health showed that since 2009 the rate of new HIV diagnoses had decreased 40%, infection by intravenous drug use has decreased by about 70%, and that no babies were born with HIV in 2013—HIV still disproportionately affects black residents, who have a prevalence rate of 6,224 cases per 100,000 people.
Infant Mortality Rate in DC by Race/Ethnicity
Although health indicators assist in understanding the health of a geographically defined population, they do not tell the whole story. For instance, city-wide infant mortality rates differ by race: 76.1% of infant deaths occurred to black mothers, although black mothers only accounted for 51.7% of births. Infants born to black mothers most frequently died of a disorder related to short gestation or low birth weight; infants born to white mothers, of maternal complications of pregnancy; and infants born to Hispanic mothers, of congenital malformations, deformations, and chromosomal abnormalities.
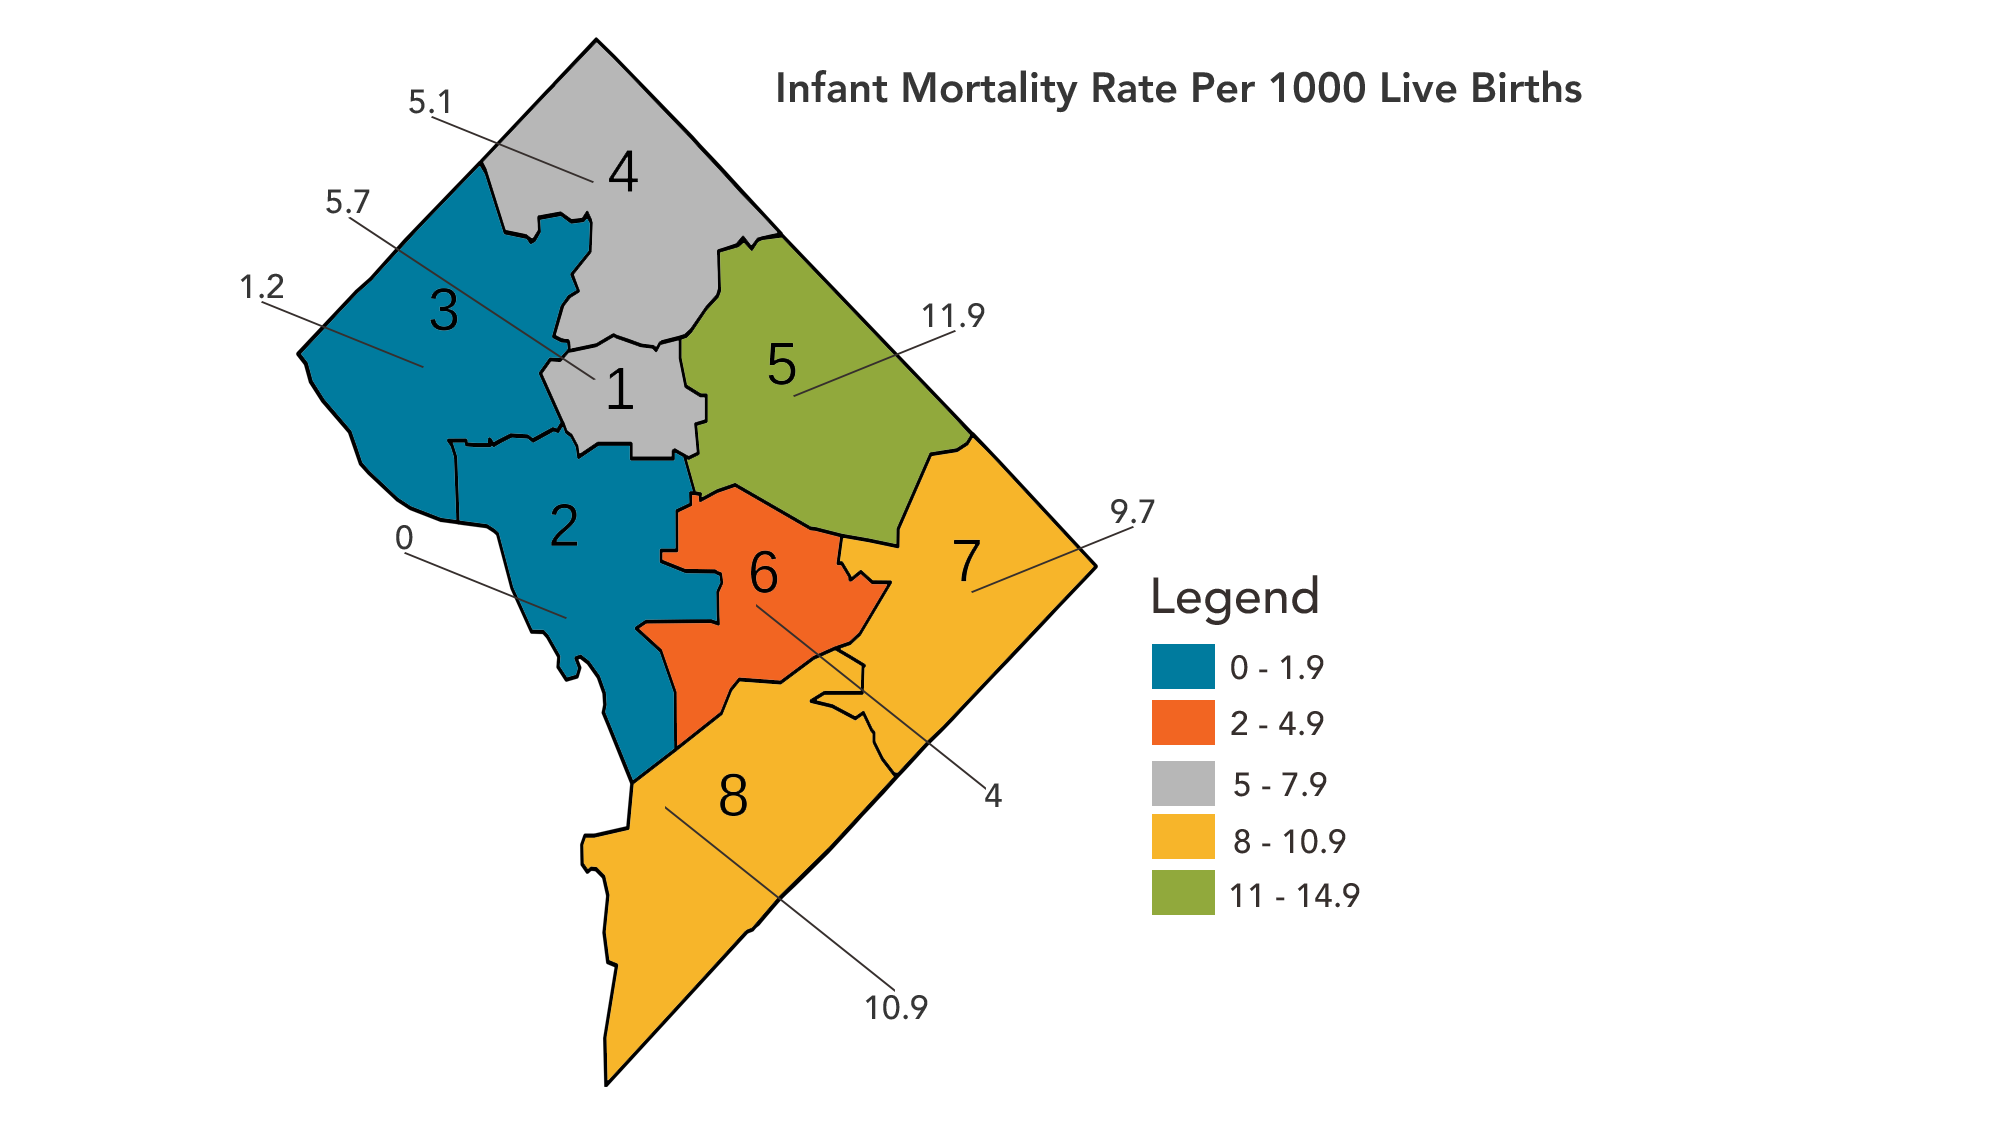
Rates also differ by the mother’s type of insurance. Although women on Medicaid and private insurance accounted for similar proportions of births, at 36.6% and 41%, respectively, infant deaths disproportionately occurred to mothers on Medicaid compared to those with private insurance at the time of delivery, at 38.1% and 14.3%, respectively. Importantly for the city, rates differ by ward. For instance, although the infant mortality rate for D.C. in 2013 was 6.8, rates ranged from 0.0 in Ward 2 to 11.9 in Ward 5. Wards with higher infant mortality rates had lower percentages of births with prenatal care beginning in the first trimester, and higher percentages of births with late or no prenatal care.
Infant Mortality Rate by Ward
The American Fitness Index has ranked Washington, DC as the nation’s fittest city for three years in a row, based on a number of personal and community health factors. For instance, 28% of District of Columbia residents are obese, compared to 63.8% nationally. Although data indicates that the region is healthy overall, when broken down by ward, a different story emerges. Ward 3 has the lowest prevalence of obesity, at 12%. Ward 3 also has the highest median annual income, at $114,847. Wards 2, 6, 1, 4, and 5, respectively, have the next lowest obesity rates, ranging from 15.3% to 32.1%. Interestingly, this data shares the same trend as median annual income, which decreases from $93,237 in Ward 2 to $66,874 in Ward 4. The starkest difference in both obesity rate and median annual income occurs in wards 7 and 8, which have obesity rates of 35% and 42.8%, and median annual incomes of $37,199 and $34,327, respectively.
Within the District, there are significant disparities in health among people of different races, ethnicities and incomes. These differences can be partially attributed to social determinants of health, which are the conditions that people are born, grow, work, live, and age.
Washington, DC has substantial health resources. There are an estimated 1,354 primary care providers practicing in the District. Hospital care is accessible, although unevenly distributed: there are 6 hospitals located in Northwest DC, 1 in Northeast, and 1 in Southeast. Additionally, the District contains a rehabilitation hospital and several centers focused on providing care to Veterans.
According to a recent Kaiser Family Foundation analysis, the District of Columbia leads the nation in health coverage enrollment, with 74-percent of the eligible population obtaining health insurance coverage under the Affordable Care Act. The DC Healthcare Alliance Program (“the Alliance”) is a locally-funded program established in 2001 that provides medical assistance to low-income District residents who are not eligible for Medicaid, Medicare, or federally subsidized health insurance under the ACA.
The District has a robust network of 15 community health centers and other community-based health services organizations, with nearly 60 health care delivery sites. This safety-net health care system serves approximately 1 out of 3 District residents.
Although access to health care is good, there are persistent health disparities among lower-income communities, as well as black and Hispanic communities, in certain parts of the city, resulting from socioeconomic inequity.
To see the data sources used for the information above about the District of Columbia, click the purple tab on the right side of this page.
Additional resources and reports on the District of Columbia are listed below.
District of Columbia Community Health Needs Assessment 2019
The 2019 Community Health Needs Assessment for the District of Columbia was produced by the DC Health Matters Collaborative, a unique collaboration among five DC hospitals and four community health centers to serve as a roadmap for the health system to bring the District of Columbia closer to a state of health equity for all residents. This assessment prioritized the following four community needs: mental health, care coordination, health literacy, and place-based care. Findings from interviews, focus groups, and town halls led to four directives from the community. These four action areas are listed below:
- Foster Community Dialogue,
- Build Relationships,
- Develop Workforce Capacity, and
- Simplify the Path to Wellness.
If interested in attending meetings of the Community Advisory Board or working groups as the DC Health Matters Collaborative works on developing a three-year community health improvement plan (CHIP) , contact collab@dchealthmaters.org for more information.
Health Equity Report for the District of Columbia 2018
The District of Columbia Department of Health’s Office of Health Equity released the Health Equity Report for the District of Columbia 2018, a comprehensive report that focuses on social and structural determinants of health and highlights nontraditional key factors that affect health, such as education, employment, income, housing, transportation, community safety, and medical care. This report provides a baseline assessment of health equity and opportunities for health in the District by looking at nine key drivers of health to 51 statistical neighborhoods. A high-level summary for each of the eight wards is included.
Insights from the report include:
- Overall, clinical care drives only 20 percent of population health outcomes, while the remaining 80 percent is generated by non-clinical factors.
- The data shows significant differences across neighborhoods that align with disparities in health outcomes, including life expectancy, with differences of twenty-one-years between the two ends of the spectrum.
2018 DC Primary Care Needs Assessment
The Health Care Access Bureau (HCAB) within the Community Health Administration in the District of Columbia published a report on the 2018 DC Primary Care Needs Assessment (PCNA). The PCNA sought to research the following four core questions to help guide efforts to ensure that all DC residents have access to primary care.:
- Is there an unmet need for primary care services among DC residents? If so, where in the city (geographic areas) and/or among what population(s) does the unmet need exist?
- What are the factors that inhibit or facilitate District residents’ access to primary care services?
- How should the District improve access to primary care for its residents?
- How should the District continue to monitor access to primary care?
To learn more about the research approach and key findings, read the full report here and the executive summary here.
